Motorsport Racing Visualization
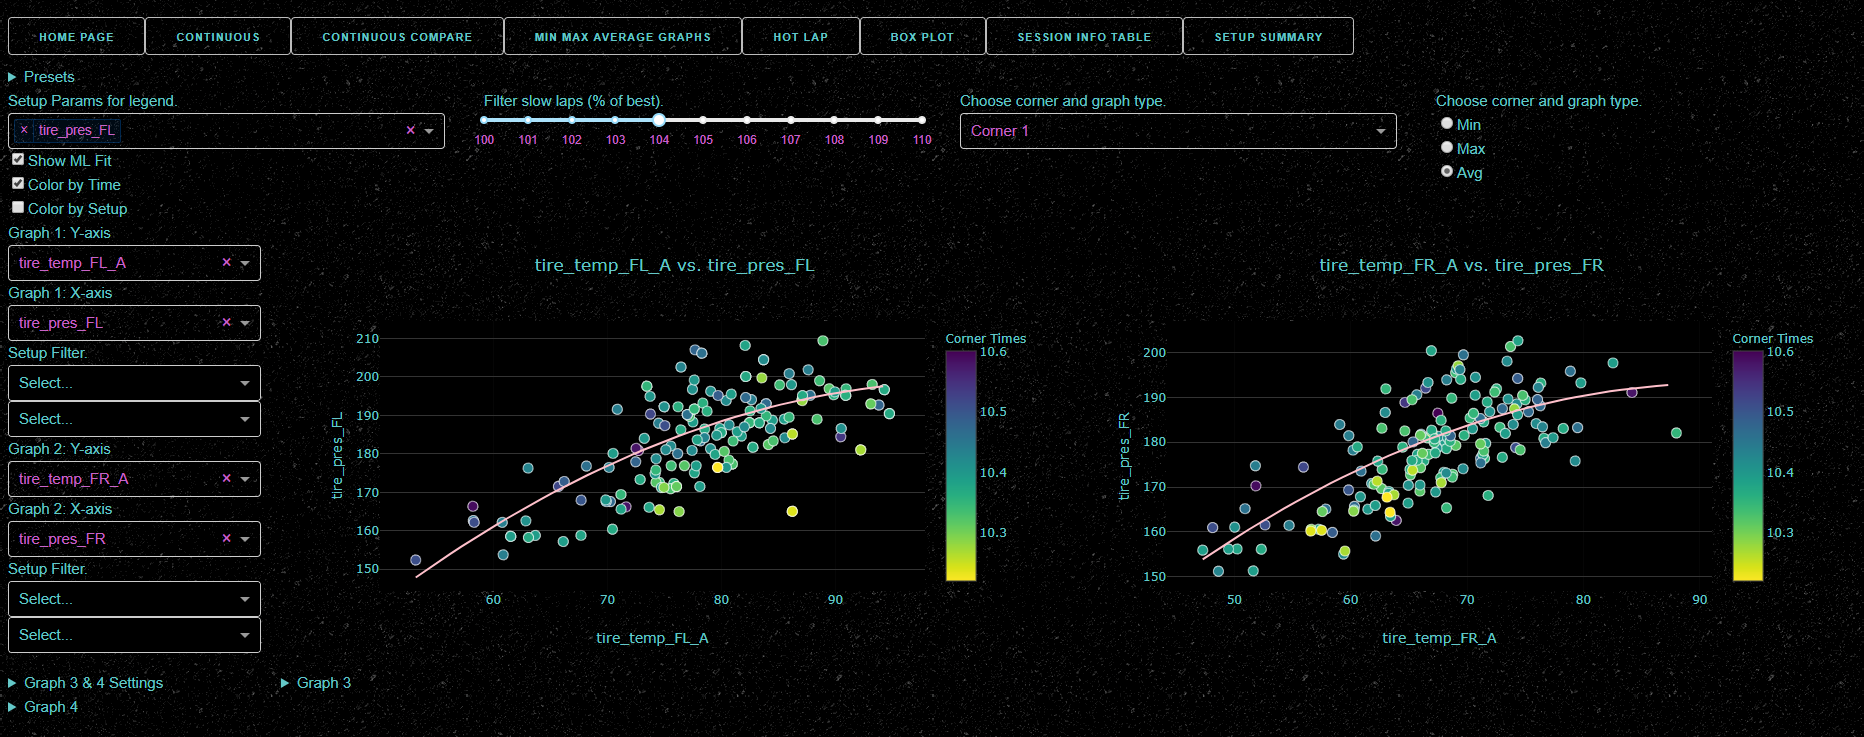
Most capstone projects are proposed by industry partners, but mine was designed by myself and an industry partner was recruited. My team built a data visualization with some machine learning features that collects and displays telemetry data from a motorsports simulation called rFactor 2. We collected the data using a C++ plugin and hosted the visualization using Python and Dash (plotly). Motorsports is a data-driven team sport that requires expert knowledge of how the settings of a car impact performance and endurance. Our goal was to build a modular project that would help distill the data down to meaningful graphs and allow the community to add features as well.
Our project was featured in the capstone festival and we achieved our goal of improving lap times by one second over a two-mile course. Simulations are widely used to prepare car setups for real race weekends, and our tool improves on the existing alternatives because of its focus on supporting a simulation (rather than real-world telemetry), and it has the potential to be the community’s gold standard if we support the most popular consumer simulators. We plan on releasing it open-source soon. Stay tuned.
Unfortunately, when my school account was deactivated, I lost this project and presentation with it. I just kept the experience!